Fig. 17
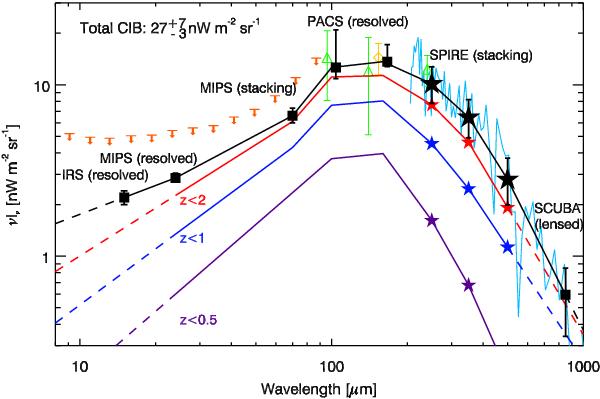
Spectral energy distribution of the CIB. Black filled stars: our total extrapolated CIB at 250 μm, 350 μm, and 500 μm. Black filled squares: total extrapolated CIB from deep number counts at 16 μm (Teplitz et al. 2011), 24 μm and 70μm (Béthermin et al. 2010a), 100 μm and 160 μm (Berta et al. 2011), and 850 μm (Zemcov et al. 2010). Colored solid lines: contribution of the z < 0.5 (purple), z < 1 (dark blue), and z < 2 (red) sources to the CIB from the counts measured by Le Floc’h et al. (2009) at 24 μm, Berta et al. (2011) at 70 μm, 100 μm, and 160 μm), and in this paper at 250 μm, 350 μm, and 500 μm. Colored filled stars: our total extrapolated CIB at 250 μm, 350 μm, 500 μm for various cuts in redshift. The colored stars indicate our new points. The dashed lines correspond to the extrapolation of these contributions below 24 μm and above 500 μm. Cyan solid line: Absolute CIB spectrum measured by COBE/FIRAS (Lagache et al. 2000). Green triangles: absolute CIB measurements performed by COBE/DIRBE at 100 μm, 140 μm, and 240 μm (updated in Dole et al. 2006). Yellow diamond: absolute measurements of Pénin et al. (2012b) at 160 μm with Spitzer/MIPS. Orange arrows: upper limits derived from opacity of the Universe to TeV photons (Mazin & Raue 2007). The Berta et al. (2011), Pénin et al. (2012b), and COBE/FIRAS points have been slightly shifted in wavelength for clarity.
Current usage metrics show cumulative count of Article Views (full-text article views including HTML views, PDF and ePub downloads, according to the available data) and Abstracts Views on Vision4Press platform.
Data correspond to usage on the plateform after 2015. The current usage metrics is available 48-96 hours after online publication and is updated daily on week days.
Initial download of the metrics may take a while.