Fig. 15
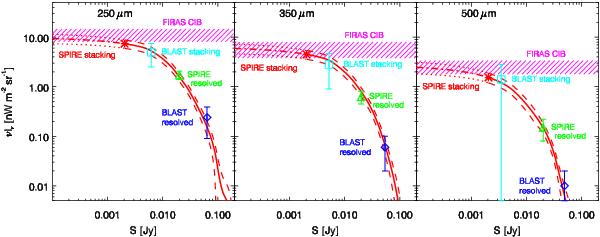
Cumulative contribution to the CIB as a function of the flux density cut at 250 μm (left), 350 μm (center), and 500 μm (right). Red: cumulative contribution from our counts. The asterisks represents the fraction resolved at the limit used for our analysis. Cyan: contribution of the BLAST sources probed by stacking (Béthermin et al. 2010b). Green: contribution of the sources resolved by SPIRE (Oliver et al. 2010b). Blue: contribution of the sources resolved by BLAST (Béthermin et al. 2010b). Violet hatched region: FIRAS absolute measurement of the CIB; a region is hatched here if it is in the 1-σ confidence region of Fixsen et al. (1998) or Lagache et al. (2000).
Current usage metrics show cumulative count of Article Views (full-text article views including HTML views, PDF and ePub downloads, according to the available data) and Abstracts Views on Vision4Press platform.
Data correspond to usage on the plateform after 2015. The current usage metrics is available 48-96 hours after online publication and is updated daily on week days.
Initial download of the metrics may take a while.