Free Access
Fig. 6
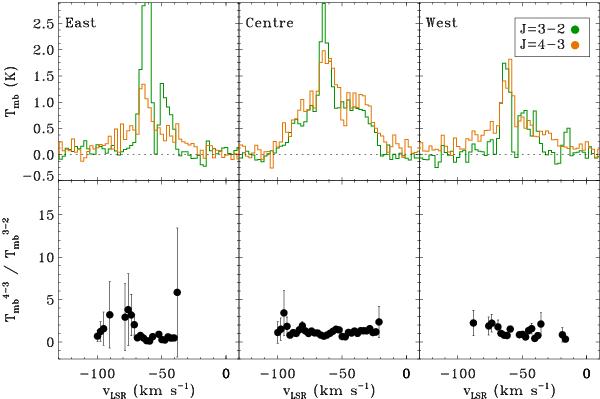
Top: the two CO lines detected are plotted on each other, after resampling the spectra at a resolution of 2.5 km s-1. Bottom: the ratio of the two lines is shown for points where the emission from both lines is above their respective noises.
Current usage metrics show cumulative count of Article Views (full-text article views including HTML views, PDF and ePub downloads, according to the available data) and Abstracts Views on Vision4Press platform.
Data correspond to usage on the plateform after 2015. The current usage metrics is available 48-96 hours after online publication and is updated daily on week days.
Initial download of the metrics may take a while.