Free Access
Fig. 5
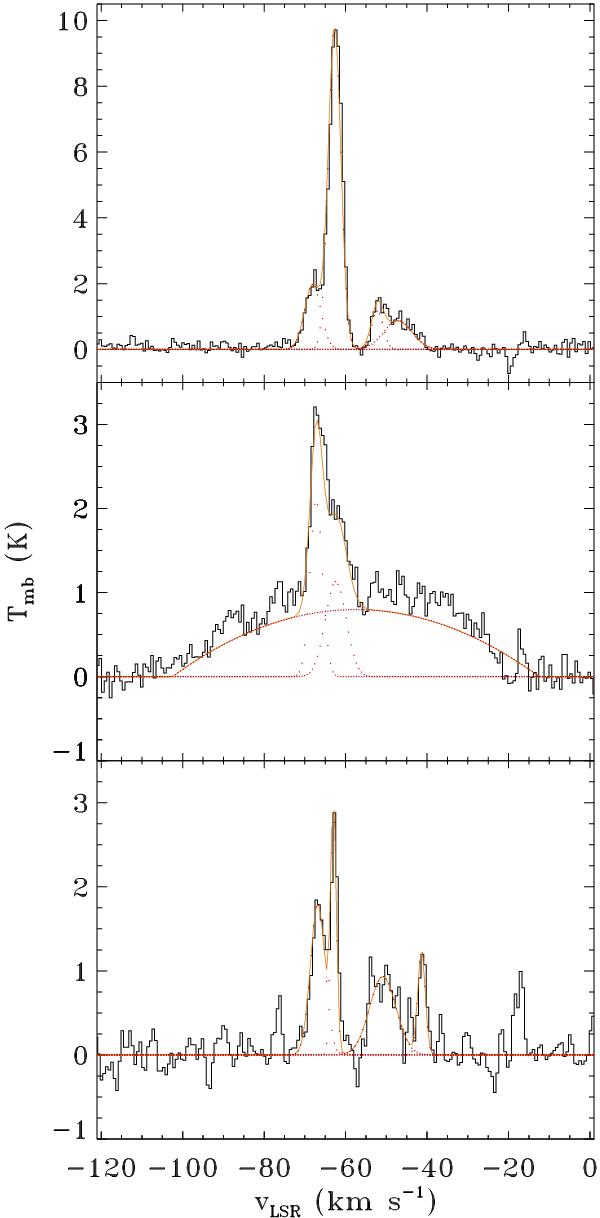
Spectra of the J = 3−2 line observed 10′′ northeast of the central source in IRAS 15452−5459 (top), on the central source (center) and 10′′ southwest of the central position (bottom). Overplotted in red are Gaussian fittings to the narrow features and a parabola for the broad component in the central pointing.
Current usage metrics show cumulative count of Article Views (full-text article views including HTML views, PDF and ePub downloads, according to the available data) and Abstracts Views on Vision4Press platform.
Data correspond to usage on the plateform after 2015. The current usage metrics is available 48-96 hours after online publication and is updated daily on week days.
Initial download of the metrics may take a while.