Fig. 5
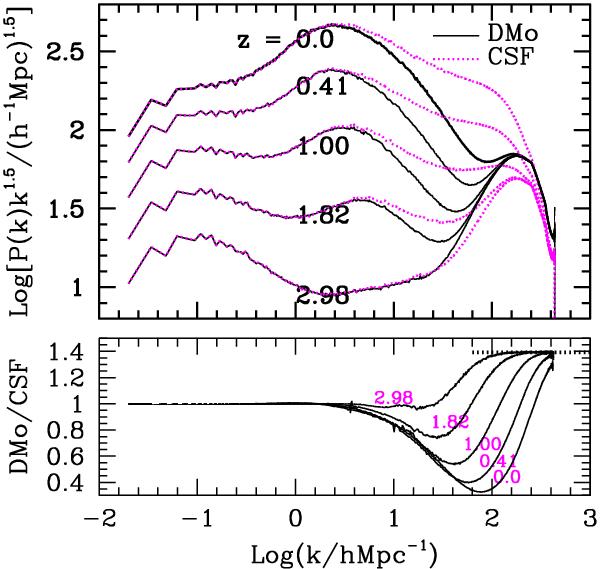
The same as in F 4 but for the comparison between the radiative (CSF) simulation and the DMo simulation. Top panel: the larger amplitude of the CSF power spectrum is clearly visible, well before the onset of white noise at large-k. Bottom panel: ratio of the DMo to CSF spectra. A slight lack of power in CSF, up to k ≃ 10 h Mpc-1, is hardly appreciable.
Current usage metrics show cumulative count of Article Views (full-text article views including HTML views, PDF and ePub downloads, according to the available data) and Abstracts Views on Vision4Press platform.
Data correspond to usage on the plateform after 2015. The current usage metrics is available 48-96 hours after online publication and is updated daily on week days.
Initial download of the metrics may take a while.