Fig. 4
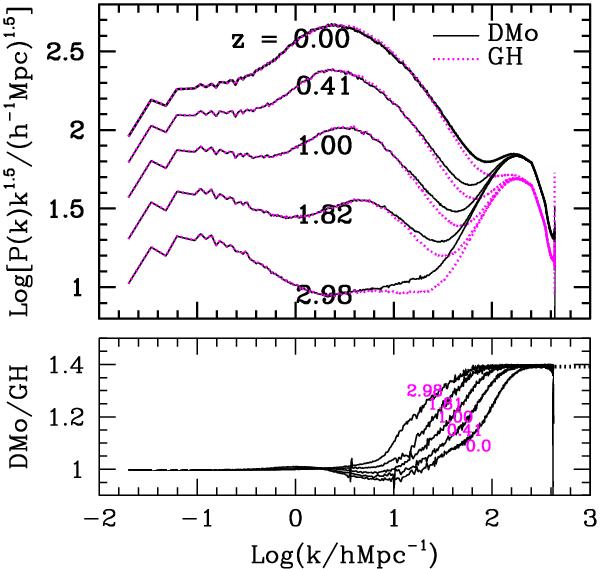
Power spectra of density fluctuations for the non-radiative (GH) hydrodynamical and DMo simulations. Results are shown for f = 5. Top panel: evolution between z ≃ 3 and z = 0 for the GH (solid curves) and DMo (dotted curves) simulations. Redshift values are indicated at the side of each curve. Here, the small spectral differences are hardly visible, up to the onset of white noise at large-k. Bottom panel: ratio of power spectra of the DMo to GH simulations. A slight excess of power in the GH simulation is visible up to k ≃ 10 h Mpc-1. The inversion at higher k value is covered by the onset of white noise (see also Fig. 2). Note the different levels of white noise in the two simulations, owing to the different numbers of particles used (see text).
Current usage metrics show cumulative count of Article Views (full-text article views including HTML views, PDF and ePub downloads, according to the available data) and Abstracts Views on Vision4Press platform.
Data correspond to usage on the plateform after 2015. The current usage metrics is available 48-96 hours after online publication and is updated daily on week days.
Initial download of the metrics may take a while.