Fig. 3
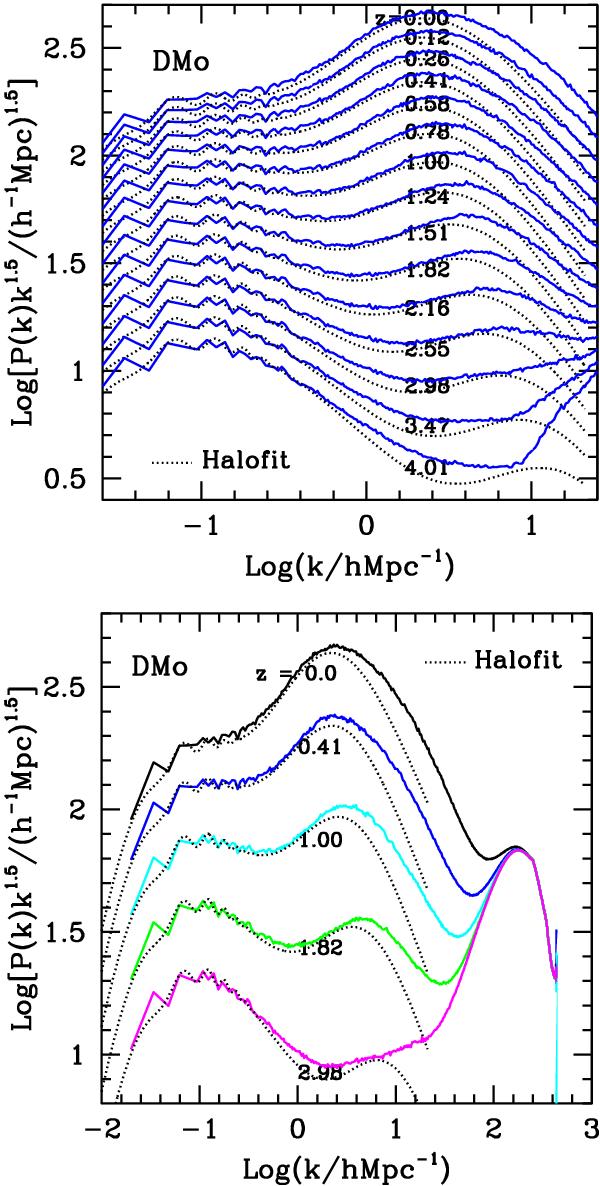
Spectral evolution, for DMo simulations, in the redshift range used to compile shear spectra. Spectra obtained with f = 5 are shown. Simulations are also compared with the HF predictions. In the top panel, we show all spectra (multiplied by k3/2, to allow an overall comparison) in a restricted k range. Redshift values are shown along aside each curve. In the bottom panel, we select five redshift values and plot spectra over a wider k interval. Substantial discrepancies from HF are evident, even at low k values, at any redshift.
Current usage metrics show cumulative count of Article Views (full-text article views including HTML views, PDF and ePub downloads, according to the available data) and Abstracts Views on Vision4Press platform.
Data correspond to usage on the plateform after 2015. The current usage metrics is available 48-96 hours after online publication and is updated daily on week days.
Initial download of the metrics may take a while.