Free Access
Fig. 17
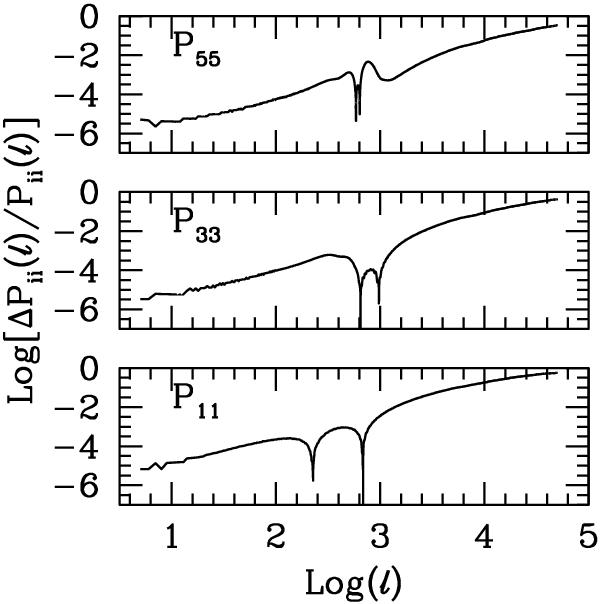
Relative difference in the shear spectra for the CSF and the DMo simulations, for the three different values of i,j reported in the labels. The sign of the shift changes in two points. Between them, the logarithm of the modulus is plotted.
Current usage metrics show cumulative count of Article Views (full-text article views including HTML views, PDF and ePub downloads, according to the available data) and Abstracts Views on Vision4Press platform.
Data correspond to usage on the plateform after 2015. The current usage metrics is available 48-96 hours after online publication and is updated daily on week days.
Initial download of the metrics may take a while.