Fig. 1
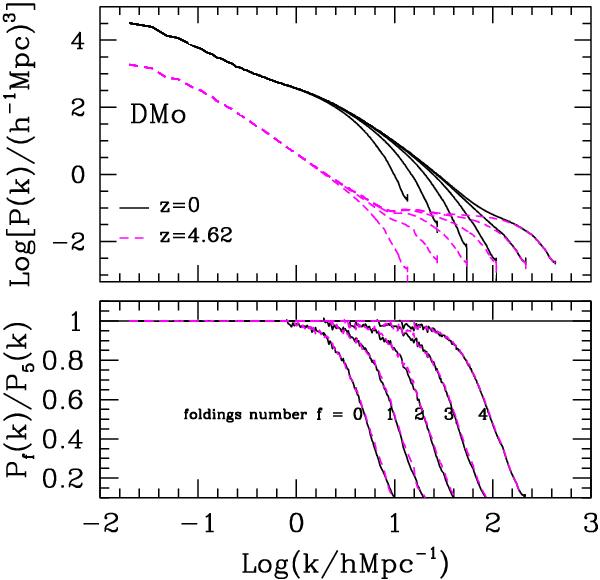
Upper panel: power spectra for the DM-only simulation, obtained by using n3 grids with effective n from 1024 to 32 768, are shown at z = 0 (solid curves) and z = 4.62 (dashed curves). The latter is the highest redshift at which non-linear spectral features are (barely) visible above the numerical noise. In contrast, at z = 0, numerical noise affects only the spectrum at the highest resolution. Lower panel: the ratios of Pf(k) (f = 0,..., 4) to P5(k) are plotted. Values of this ratio at the two considered redshifts are almost indistinguishable and this plot explicitly shows that they do not depend on the extension of numerical noise and are self-similar when the resolution limit is shifted.
Current usage metrics show cumulative count of Article Views (full-text article views including HTML views, PDF and ePub downloads, according to the available data) and Abstracts Views on Vision4Press platform.
Data correspond to usage on the plateform after 2015. The current usage metrics is available 48-96 hours after online publication and is updated daily on week days.
Initial download of the metrics may take a while.