Free Access
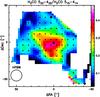
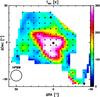
Fig. 5
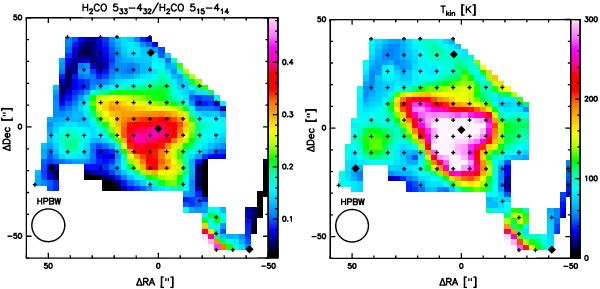
Left panel: ratio of 533−432 to the 515−414 H2CO transition. Right panel: kinetic temperature map of W49A determined from line ratio shown in the left panel.
This figure is made of several images, please see below:
Current usage metrics show cumulative count of Article Views (full-text article views including HTML views, PDF and ePub downloads, according to the available data) and Abstracts Views on Vision4Press platform.
Data correspond to usage on the plateform after 2015. The current usage metrics is available 48-96 hours after online publication and is updated daily on week days.
Initial download of the metrics may take a while.