Fig. 3
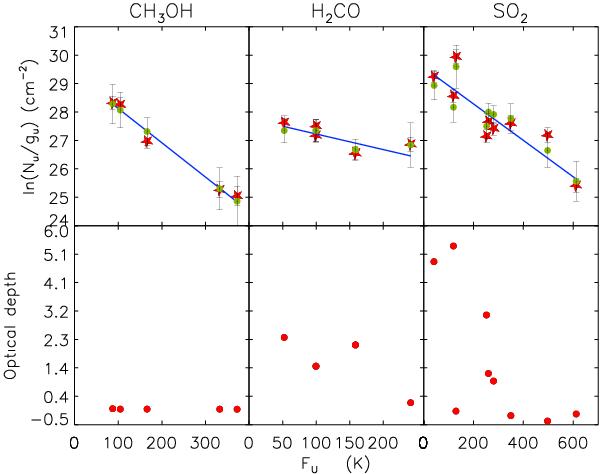
The results of the rotation diagram analysis for H2CO toward the center. Top panels: the results of the rotation diagram analysis before (red symbols) and after (green symbols) corrections for optical depth and beam dilution. The overplotted blue line corresponds to a linear fit to the rotational diagram without corrections. Bottom panels: the corresponding best fit optical depths from the χ2 minimization.
Current usage metrics show cumulative count of Article Views (full-text article views including HTML views, PDF and ePub downloads, according to the available data) and Abstracts Views on Vision4Press platform.
Data correspond to usage on the plateform after 2015. The current usage metrics is available 48-96 hours after online publication and is updated daily on week days.
Initial download of the metrics may take a while.