Free Access
Fig. 2
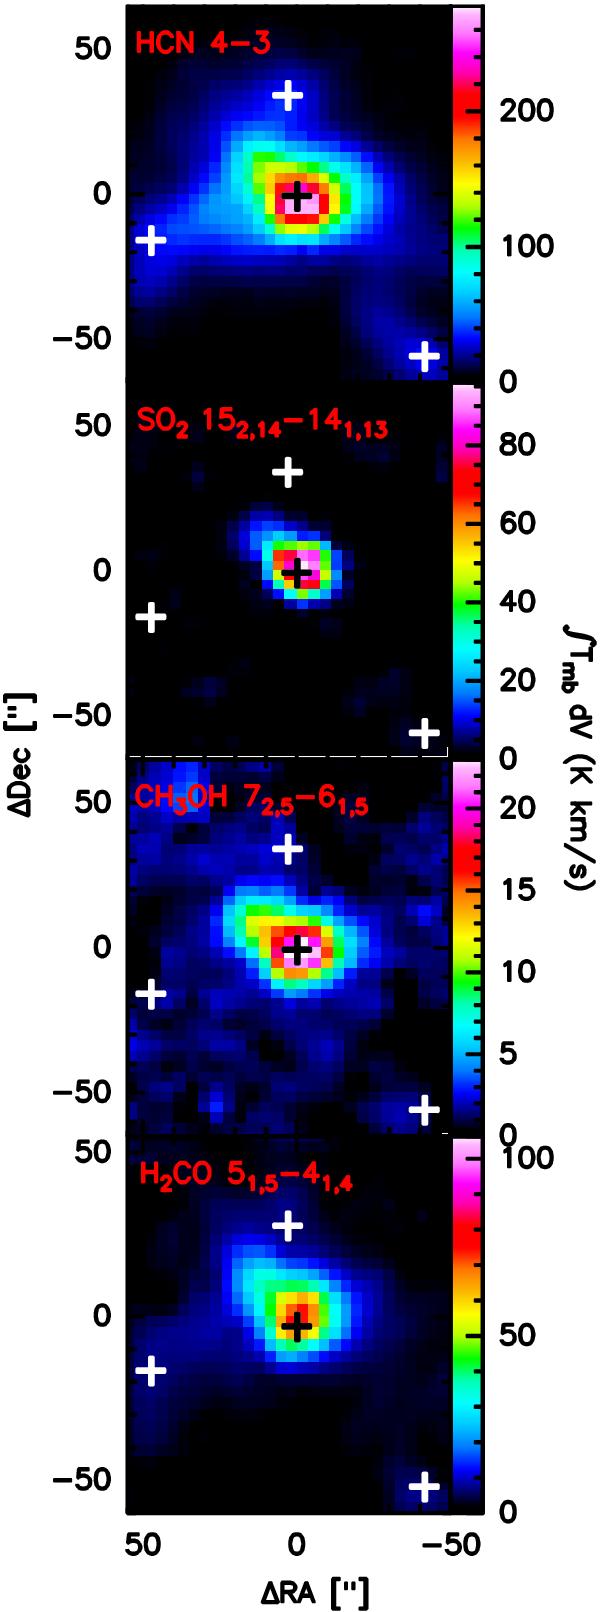
The integrated intensity distribution of HCN 4−3, SO2 152,14−141,13, CH3OH 72,5−61,5 and H2CO 515−414. The central position is shown with black plus signs, the off-center regions (northern clump, eastern tail and southwest clump) are also shown with white plus signs.
Current usage metrics show cumulative count of Article Views (full-text article views including HTML views, PDF and ePub downloads, according to the available data) and Abstracts Views on Vision4Press platform.
Data correspond to usage on the plateform after 2015. The current usage metrics is available 48-96 hours after online publication and is updated daily on week days.
Initial download of the metrics may take a while.