Fig. 9
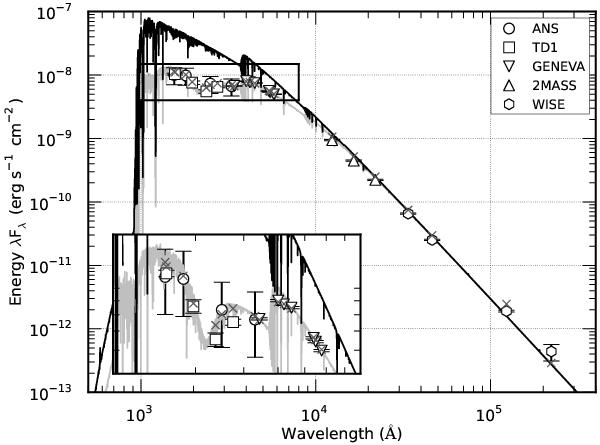
Spectral energy distribution of HD 50230. Observations and their associated errors are shown with different open markers (see legend). Synthetic photometry from the best-fitting model (grey solid line, the unreddened model is shown as the black solid line) are marked with crosses. The inset is a zoom on the ultraviolet region.
Current usage metrics show cumulative count of Article Views (full-text article views including HTML views, PDF and ePub downloads, according to the available data) and Abstracts Views on Vision4Press platform.
Data correspond to usage on the plateform after 2015. The current usage metrics is available 48-96 hours after online publication and is updated daily on week days.
Initial download of the metrics may take a while.