Fig. 7
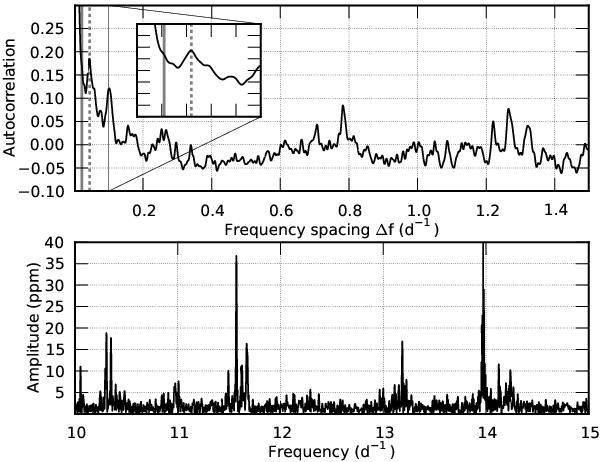
Autocorrelation (upper panel) of the frequency spectrum (lower panel) between 10 and 15 d-1 (with the frequencies outside this region removed) uncovers a multiplet spacing of Δf = 0.044 d-1 that was measured between the peaks near ~10.4 d-1 and ~11.6 d-1. The peak around ~0.8 d-1 originates from the spacing between the structures around 13.2 d-1 and 14 d-1 (bottom panel), and those at 10.3 d-1 and 11 d-1. The thick grey line is plotted at a separation of 3/T for comparison with the frequency resolution.
Current usage metrics show cumulative count of Article Views (full-text article views including HTML views, PDF and ePub downloads, according to the available data) and Abstracts Views on Vision4Press platform.
Data correspond to usage on the plateform after 2015. The current usage metrics is available 48-96 hours after online publication and is updated daily on week days.
Initial download of the metrics may take a while.