Fig. 5
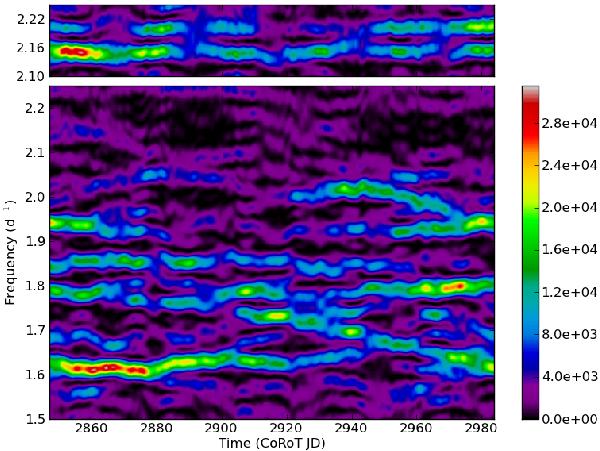
Short-time Fourier transformation of the frequency region between 1.5 and 2.3 d-1 with a rectangular window of width 30 d-1. All signal outside of these regions is removed. Clear signal is present (colours denote squared amplitude in ppm2), and the frequencies and amplitudes show hints of variability. As a reference, the top panel shows a copy of the upper part of plot, where two artificial constant sine curves are introduced.
Current usage metrics show cumulative count of Article Views (full-text article views including HTML views, PDF and ePub downloads, according to the available data) and Abstracts Views on Vision4Press platform.
Data correspond to usage on the plateform after 2015. The current usage metrics is available 48-96 hours after online publication and is updated daily on week days.
Initial download of the metrics may take a while.