Fig. 4
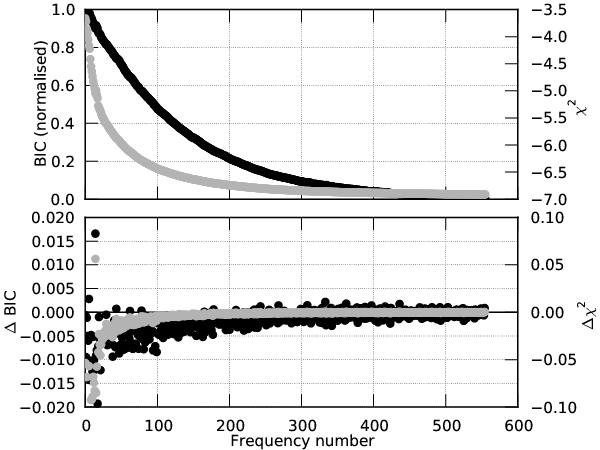
Goodness-of-fit statistics of the sine-model. Both the BIC (black) and χ2 (grey) show a general decreasing trend (top panel), suggesting that sines are a good way of modelling the light curve. Despite the general decrease, however, not all frequencies are adequately modelled by sines: some frequencies in particular induce a worse BIC (ΔBIC > 0) (lower panel).
Current usage metrics show cumulative count of Article Views (full-text article views including HTML views, PDF and ePub downloads, according to the available data) and Abstracts Views on Vision4Press platform.
Data correspond to usage on the plateform after 2015. The current usage metrics is available 48-96 hours after online publication and is updated daily on week days.
Initial download of the metrics may take a while.