Fig. 2
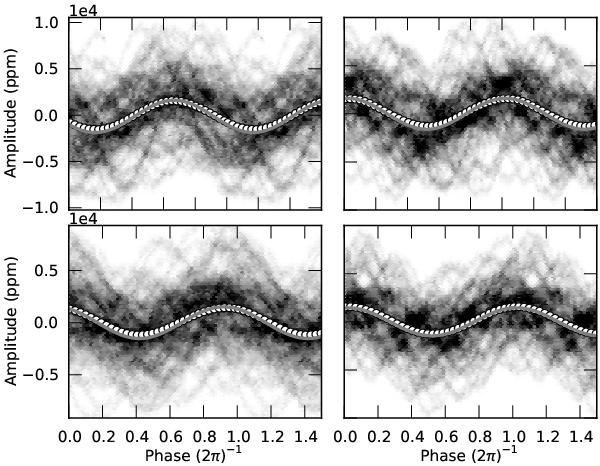
Phase-folded light curves of the highest amplitude frequencies show that only one sine component is needed to fit the shape (from left to right, top to bottom: f001, f002, f004, and f005). The black dots are observations, the white circles are phase-binned averages, the thin grey line is a sine-fit (the exponent of the y-axis scale is given at the top of the plot).
Current usage metrics show cumulative count of Article Views (full-text article views including HTML views, PDF and ePub downloads, according to the available data) and Abstracts Views on Vision4Press platform.
Data correspond to usage on the plateform after 2015. The current usage metrics is available 48-96 hours after online publication and is updated daily on week days.
Initial download of the metrics may take a while.