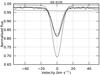
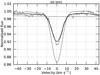
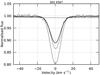
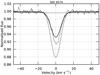
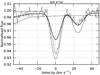
Fig. A.1
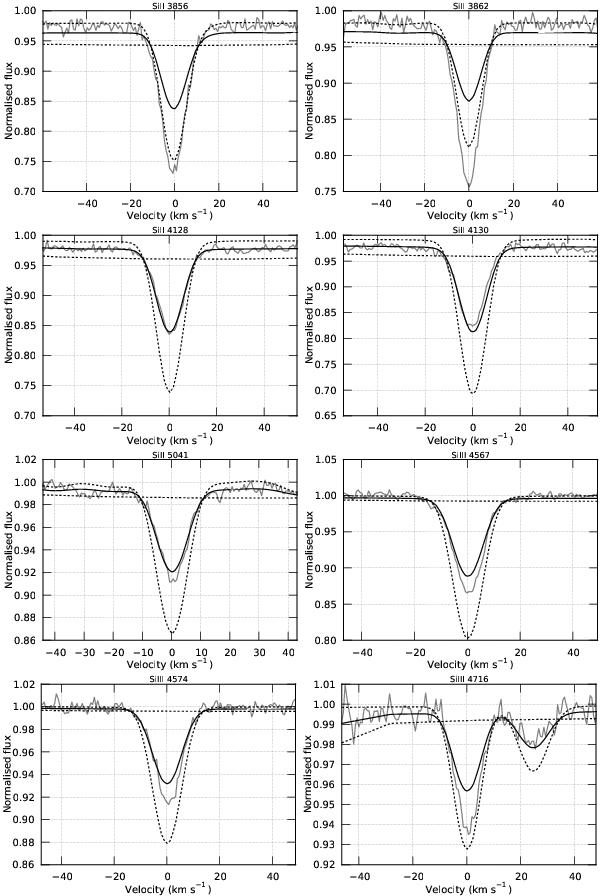
Binary fit to a selection of spectral lines. In grey, the average of all observed HARPS spectra of HD 50230 is plotted. Dashed black lines denote the contributions of the separate companions, the solid black line shows the obtained binary fit. Note that due to the simultaneous fitting of the continuum with the lines, the line continuum level can be off if the line does not fit well (i.e., the average quadratic distance between the observed and synthetic line profile is minimised). The fit consists of a primary component with Teff = 18 500 K and log g = 4.0 (cgs), and Teff = 15 000 K and log g = 4.0 (cgs) for the secondary.
Current usage metrics show cumulative count of Article Views (full-text article views including HTML views, PDF and ePub downloads, according to the available data) and Abstracts Views on Vision4Press platform.
Data correspond to usage on the plateform after 2015. The current usage metrics is available 48-96 hours after online publication and is updated daily on week days.
Initial download of the metrics may take a while.