Fig. 1
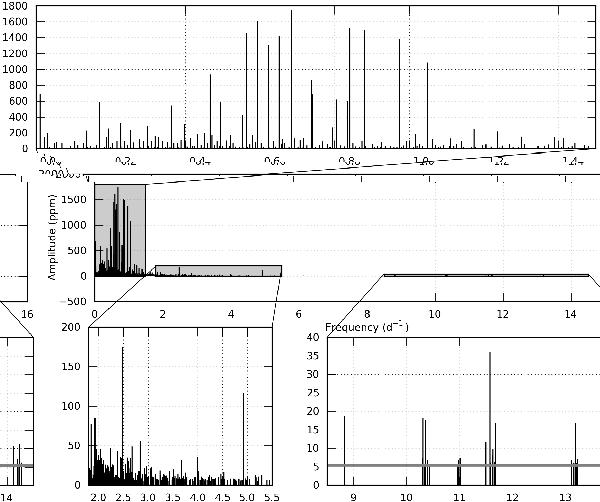
Frequency diagram (units of d-1 on the x-axis, and ppm on the y-axis) containing all frequencies from the iterative prewhitening analysis. The centre panel shows the whole range of detected frequencies. The top panel is a zoom-in on the gravity mode region. The bottom right panel is a zoom-in on the pressure mode region (grey line is the detection threshold). The bottom left panel shows the intermediate region with two modes clearly standing out amongst the other frequencies.
Current usage metrics show cumulative count of Article Views (full-text article views including HTML views, PDF and ePub downloads, according to the available data) and Abstracts Views on Vision4Press platform.
Data correspond to usage on the plateform after 2015. The current usage metrics is available 48-96 hours after online publication and is updated daily on week days.
Initial download of the metrics may take a while.