Fig. 8
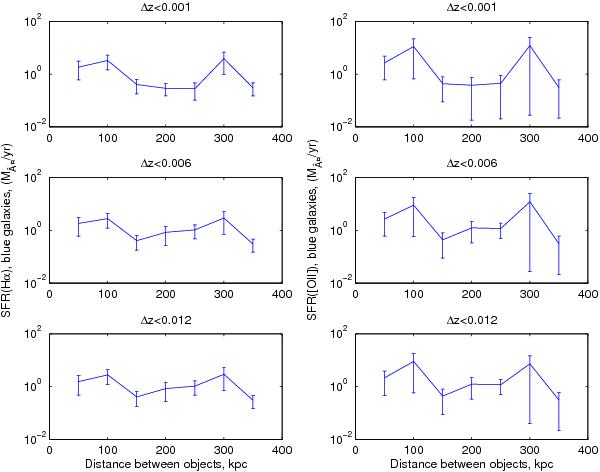
Star formation rate in blue companion galaxies in solar masses per year. Left column shows SFR from from Hα-flux. Right column shows SFR calculated from [O ii]-flux. Three different redshift difference cuts are pictured for the pairs, top: | Δz | = 0.001, middle: | Δz | = 0.006, bottom: | Δz | = 0.012. Galaxies with SFR > 100 and individual errors in SFRerror > 1000 are excluded. The individual errors are unweighted in the calculations of mean values and error bars. Only objects with emission line fluxes that are greater than three times the error in the emission line flux are included.
Current usage metrics show cumulative count of Article Views (full-text article views including HTML views, PDF and ePub downloads, according to the available data) and Abstracts Views on Vision4Press platform.
Data correspond to usage on the plateform after 2015. The current usage metrics is available 48-96 hours after online publication and is updated daily on week days.
Initial download of the metrics may take a while.