Fig. 4
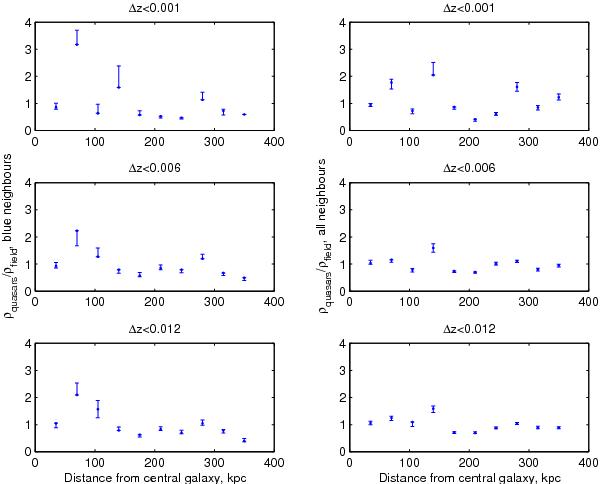
Results from the spectroscopic redshift samples. Ratio of annular surface densities of galaxies around quasars (ρquasars) and the annular surface densities of galaxies around central non-AGN field galaxies (ρfield) as function of projected distance. The field galaxies were chosen to be inside the same magnitude range as the quasars in order to compare objects of same mass range, having −24 < Mr < −19. The plot includes AGN among the companion galaxies. In the left column: blue galaxies with Ue − Re < 2.2, in right column: all galaxies. Three different redshift difference cuts | Δz | are pictured for the pairs, top: | Δz | = 0.001, middle: | Δz | = 0.006, bottom: | Δz | = 0.012. The ratio is normalized for the difference in sample size.
Current usage metrics show cumulative count of Article Views (full-text article views including HTML views, PDF and ePub downloads, according to the available data) and Abstracts Views on Vision4Press platform.
Data correspond to usage on the plateform after 2015. The current usage metrics is available 48-96 hours after online publication and is updated daily on week days.
Initial download of the metrics may take a while.