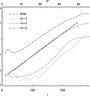
Fig. 4
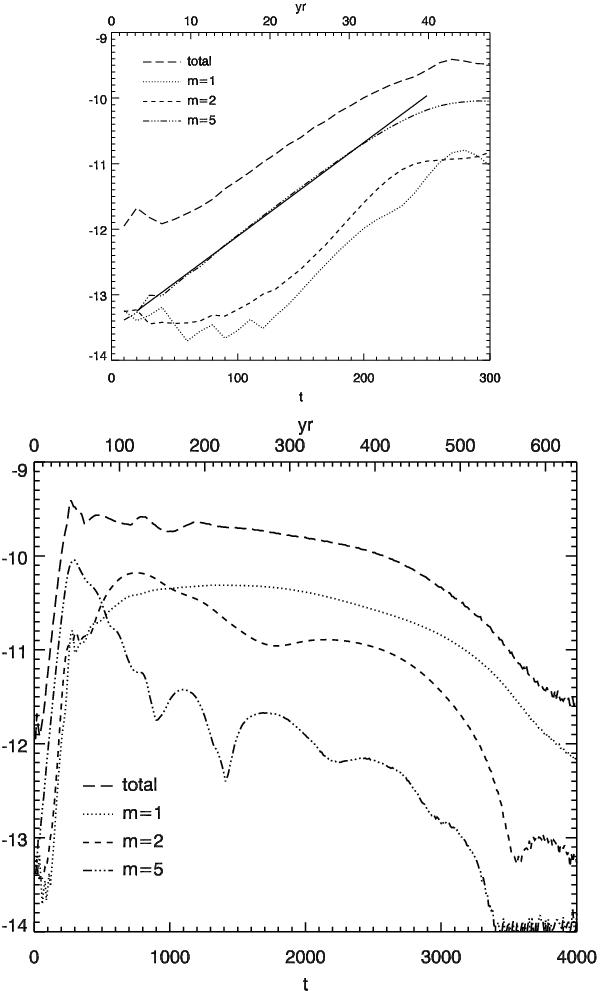
Time evolution of the amplitudes of the density perturbations in a logarithmic scale. The time is given in code units (lower axis) and in years (upper axis). We also show the amplitude of some of the modes with low mode number. The upper figure is a zoom on the exponential growth where we have added a linear fit for the dominant mode, whose growth rate is 0.033 in code units.
Current usage metrics show cumulative count of Article Views (full-text article views including HTML views, PDF and ePub downloads, according to the available data) and Abstracts Views on Vision4Press platform.
Data correspond to usage on the plateform after 2015. The current usage metrics is available 48-96 hours after online publication and is updated daily on week days.
Initial download of the metrics may take a while.