Free Access
Fig. 2
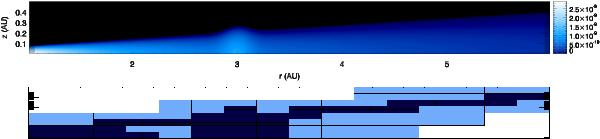
Initial gas density in the disc in g cm-3 (up) and AMR grid (down). The three levels are plotted in white, blue and dark blue from lower to higher resolution. The highest resolution is reached in the overdensity region and at the interface between the disc and corona.
This figure is made of several images, please see below:

Current usage metrics show cumulative count of Article Views (full-text article views including HTML views, PDF and ePub downloads, according to the available data) and Abstracts Views on Vision4Press platform.
Data correspond to usage on the plateform after 2015. The current usage metrics is available 48-96 hours after online publication and is updated daily on week days.
Initial download of the metrics may take a while.