Fig. 10
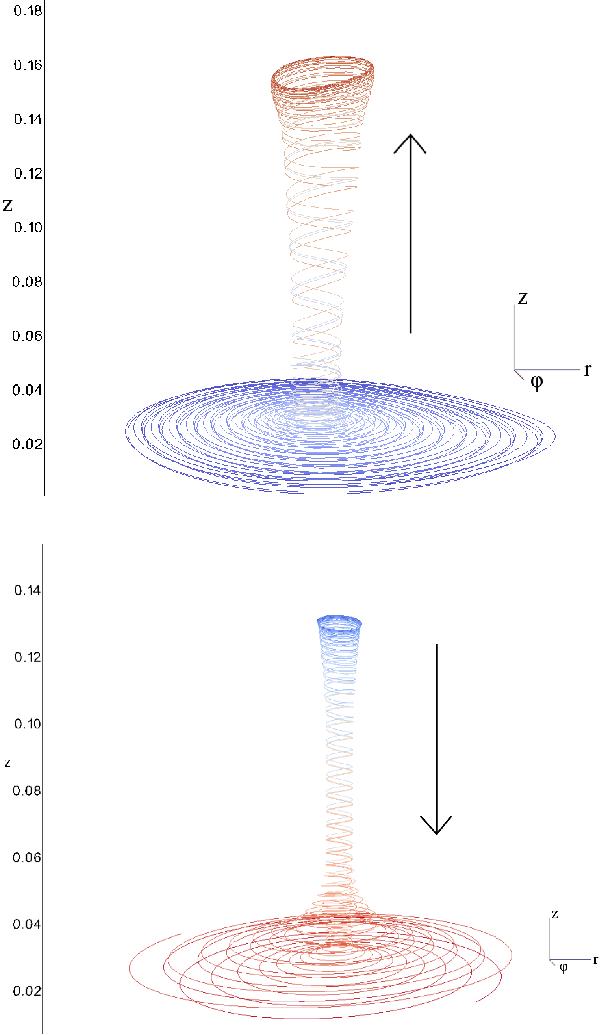
Some streamlines that pass next to the centre of the anticyclone (upper figure) and cyclone (lower figure) at t = 300 are plotted in 3D. The direction of the flow is given by the colours: the flow moves from the blue part to the red part. The cyclone is a downward flow, contrary to the upward anticyclonic flow. The vortices have a coherent structure over the whole height of the disc. The radial extent of this figure corresponds approximately to half of of Fig. 9: only the inner parts of the vortices are shown here.
Current usage metrics show cumulative count of Article Views (full-text article views including HTML views, PDF and ePub downloads, according to the available data) and Abstracts Views on Vision4Press platform.
Data correspond to usage on the plateform after 2015. The current usage metrics is available 48-96 hours after online publication and is updated daily on week days.
Initial download of the metrics may take a while.