Fig. 7
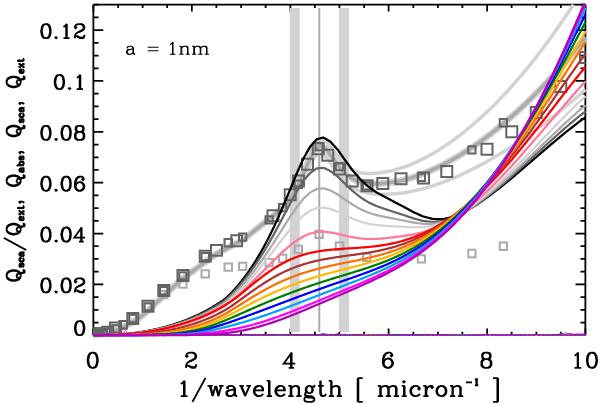
Same as for Fig. 6 but for 1 nm radius particles, with Eg increasing from top to bottom at the peak of the UV bump (at 4.6 μm-1). The vertical grey line shows the central position of the UV bump at 217 nm and the vertical, lighter grey bands on either side indicate the full width of the observed UV bump (Fitzpatrick 2004; Fitzpatrick & Massa 2007). The grey squares show the diffuse ISM extinction curve for RV = 3.1 (dark) and 5.1 (light) from (Savage & Mathis 1979, large squares) and (Mathis 1990, small squares). The grey curves indicate the average galactic extinction, and its variation (upper and lower grey curves), as derived by Fitzpatrick & Massa (2007).
Current usage metrics show cumulative count of Article Views (full-text article views including HTML views, PDF and ePub downloads, according to the available data) and Abstracts Views on Vision4Press platform.
Data correspond to usage on the plateform after 2015. The current usage metrics is available 48-96 hours after online publication and is updated daily on week days.
Initial download of the metrics may take a while.