Fig. B.3
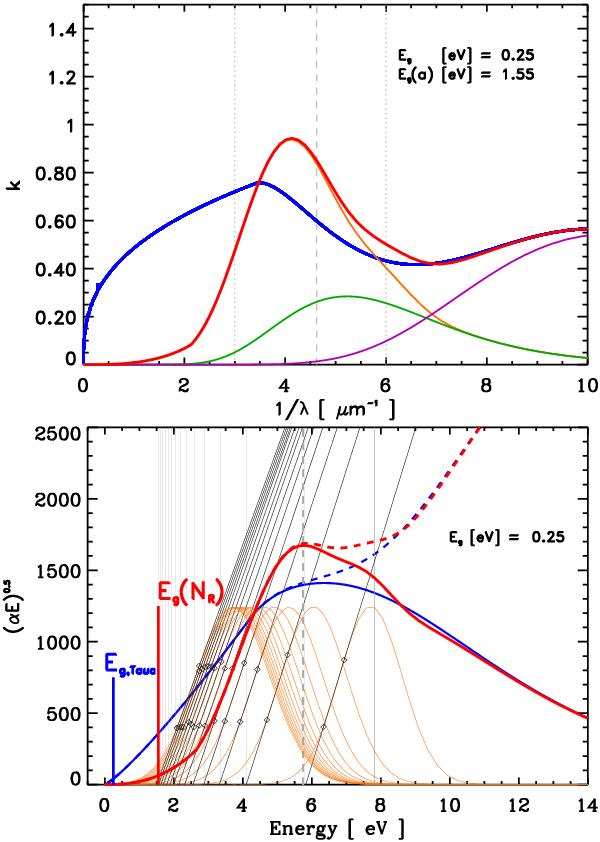
Upper figure: the L + π − π ⋆ , C6 and σ − σ∗ component contributions to the imaginary part of the refractive index, k, for Eg(bulk) = 0.25 eV and radius 0.5 nm. Lower figure: the same data presented as (αE)0.5. See text and previous figure for details.The black lines show the aromatic cluster profile extrapolations (determined by the open diamond data points) to the band gap values (thin grey vertical lines).
Current usage metrics show cumulative count of Article Views (full-text article views including HTML views, PDF and ePub downloads, according to the available data) and Abstracts Views on Vision4Press platform.
Data correspond to usage on the plateform after 2015. The current usage metrics is available 48-96 hours after online publication and is updated daily on week days.
Initial download of the metrics may take a while.