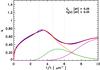
Fig. B.2
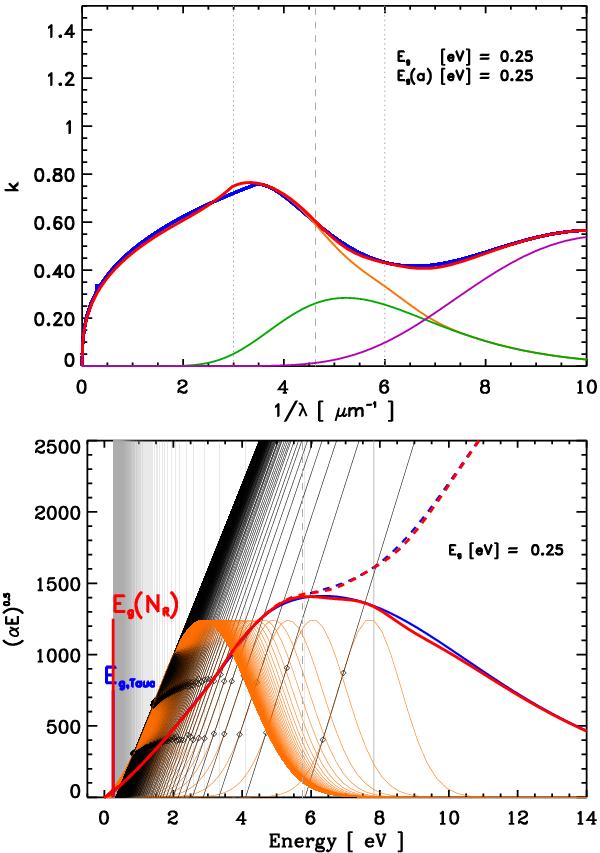
Upper figure: the π − π ⋆ and low energy adjustment (L + π − π ⋆ , orange), C6 (green) and σ − σ∗ (purple) component contributions to the imaginary part of the refractive index, k (blue line), for the optEC(s)(a) model material with Eg(bulk) = 0.25 eV and particle radius of 3 nm (The red line shows the summed L + π − π ⋆ , C6 and σ − σ∗ contributions). Lower figure: the same data as in the upper figure presented as (αE)0.5 (the blue and red lines, where the solid lines show only the summed aromatic, L + π − π ⋆ and C6 components) but where the aromatic cluster band profiles are shown for NR = 2,3,4, ...(thin orange line profiles right to left), the extrapolations to band gap (black lines with the band gap-determining extrapolation data points indicated by the open diamond symbols), the band gap values (thin grey vertical lines), the limiting Eg(NR) value and the bulk material band gap or Tauc gap, Eg,Tauc. See text for details.
Current usage metrics show cumulative count of Article Views (full-text article views including HTML views, PDF and ePub downloads, according to the available data) and Abstracts Views on Vision4Press platform.
Data correspond to usage on the plateform after 2015. The current usage metrics is available 48-96 hours after online publication and is updated daily on week days.
Initial download of the metrics may take a while.