Fig. 8
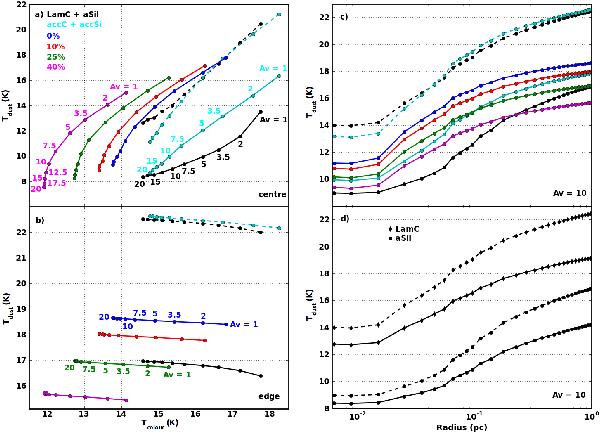
a) Equilibrium temperature of dust in the central cell of the modelled clouds, Tdust, averaged over the grain size distribution, as a function of the colour temperature, Tcolour, calculated by fitting the SEDs between 100 μm and 3000 μm. The DHGL case is represented by the black lines (the solid line is aSil and the dashed line is LamC), the accretion case by the cyan lines (the solid line is accSi and the dashed line is accC), the coagulation case with 0% of porosity by the blue line, with 10% of porosity by the red line, with 25% by the green line, and with 40% by the magenta line. b) As in a) but at the edge of the cloud. c) Tdust as a function of the cloud radius for a cloud with central AV = 10. The colour code is the same as in a). d) The same for the DHGL case (the circles show aSil and the diamonds LamC) for a cloud illuminated by the standard ISRF (dashed line) and illuminated by the ISRF extinguished by one visual magnitude (solid line).
Current usage metrics show cumulative count of Article Views (full-text article views including HTML views, PDF and ePub downloads, according to the available data) and Abstracts Views on Vision4Press platform.
Data correspond to usage on the plateform after 2015. The current usage metrics is available 48-96 hours after online publication and is updated daily on week days.
Initial download of the metrics may take a while.