Fig. 13
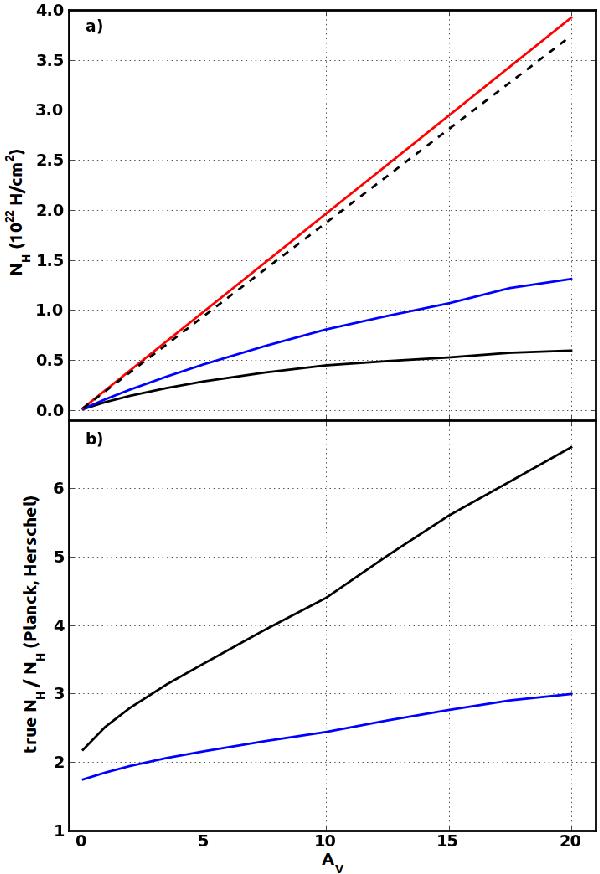
Case of the DHGL populations. a) True hydrogen column density NH at the centre of the modelled clouds as a function of the central visual extinction AV (red line). The dashed line shows the NH − AV relation measured by Bohlin et al. (1978) for the diffuse ISM. The blue line represents the column density estimated from the SED measured in the Planck-HFI and IRIS 100 μm bands, whereas the black line comes from the SED-fits made in the Herschel bands. b) Ratio of the true column density of the modelled clouds to the column densities measured in Herschel and Planck bands (black and blue, respectively).
Current usage metrics show cumulative count of Article Views (full-text article views including HTML views, PDF and ePub downloads, according to the available data) and Abstracts Views on Vision4Press platform.
Data correspond to usage on the plateform after 2015. The current usage metrics is available 48-96 hours after online publication and is updated daily on week days.
Initial download of the metrics may take a while.