Free Access
Fig. 3
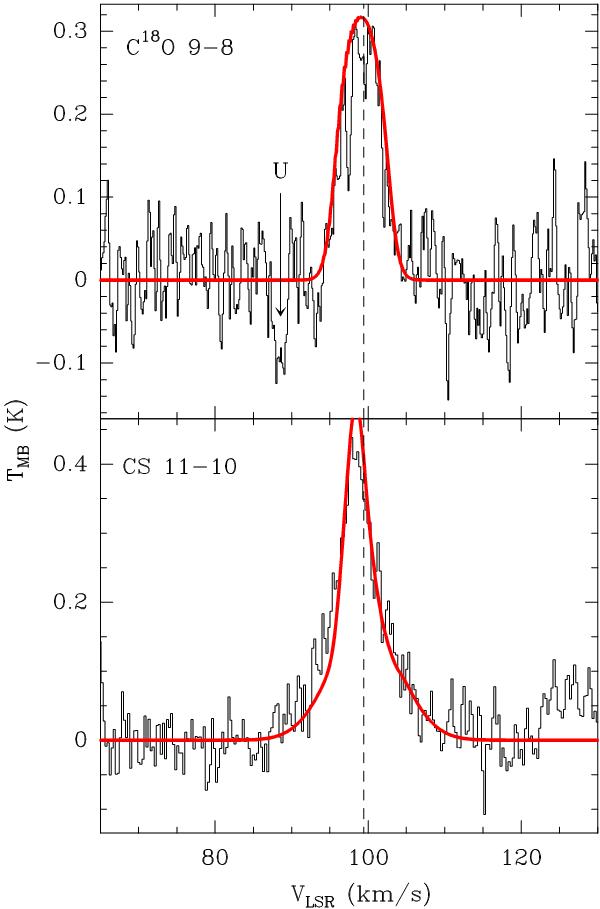
Continuum-subtracted HIFI spectra of the C18O 9–8 and CS 11–10 lines (in black). The model fits are shown as red lines over the spectra. Vertical dotted lines indicate the VLSR at 99.4 km s-1. The spectra have been smoothed to 0.2 km s-1. The unidentified line in absorption seen at 88.6 km s-1 is indicated.
Current usage metrics show cumulative count of Article Views (full-text article views including HTML views, PDF and ePub downloads, according to the available data) and Abstracts Views on Vision4Press platform.
Data correspond to usage on the plateform after 2015. The current usage metrics is available 48-96 hours after online publication and is updated daily on week days.
Initial download of the metrics may take a while.