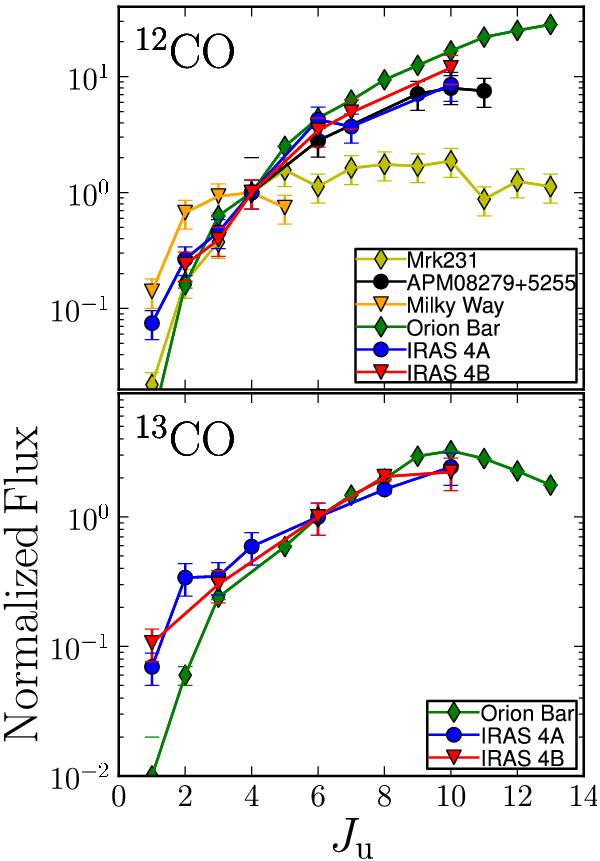
Fig. 9

CO line fluxes for the observed transitions. The 12CO and 13CO lines are normalized relative to the J = 4–3 and J = 6–5 lines, respectively. Observations of the Milky Way (Wright et al. 1991), the dense Orion Bar PDR (Habart et al. 2010), the ultraluminous galaxy Mrk231 (van der Werf et al. 2010), and the high redshift quasar APM08279+5255 (Weiss et al. 2007a) are compared. In IRAS 4A and 4B, the available maps are convolved to 20″ in order to compare similar spatial regions.
Current usage metrics show cumulative count of Article Views (full-text article views including HTML views, PDF and ePub downloads, according to the available data) and Abstracts Views on Vision4Press platform.
Data correspond to usage on the plateform after 2015. The current usage metrics is available 48-96 hours after online publication and is updated daily on week days.
Initial download of the metrics may take a while.


