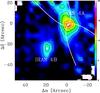
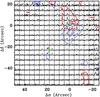
Fig. 6
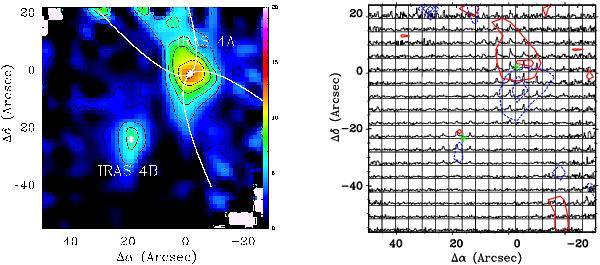
13CO 6–5 maps of IRAS 4A (0, 0) and IRAS 4B (22.5, −22.8). Left: integrated intensity map of IRAS 4A and 4B in a 80″ × 80″ area. The white elliptical biconical shape delineate the outflow cones as discussed in Sect. 6. Right: blue and redshifted outflows seen in the 13CO 6–5 line profiles overplotted on a spectral map of the same region. Individual spectra are shown on a TMB scale from –1 K to 4 K and the velocity scale runs from –5 km s-1 to 15 km s-1. The contour levels for both figures are 3σ, 6σ, 9σ, ... where σ = 0.6 K.
Current usage metrics show cumulative count of Article Views (full-text article views including HTML views, PDF and ePub downloads, according to the available data) and Abstracts Views on Vision4Press platform.
Data correspond to usage on the plateform after 2015. The current usage metrics is available 48-96 hours after online publication and is updated daily on week days.
Initial download of the metrics may take a while.