Fig. 4
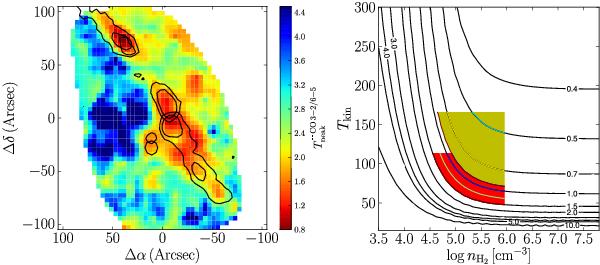
Left: map of peak intensity ratios of the 12CO 3–2/6–5 lines. Right: model of the CO 3–2/CO 6–5 line intensity ratio as function of temperature and density. The red region represents the observed range for IRAS 4A, and the yellow range for IRAS 4B. The CO column density is taken to be 1017 cm-2 with a line width of 10 km s-1, these conditions are chosen because they are representative of the observed CO 6–5 flux and line width. The colored lines give the range of densities within the 20″ beam for the two sources based on the models of Kristensen et al. (2012). In the relevant density range, smaller ratios are indicative of higher temperatures.
Current usage metrics show cumulative count of Article Views (full-text article views including HTML views, PDF and ePub downloads, according to the available data) and Abstracts Views on Vision4Press platform.
Data correspond to usage on the plateform after 2015. The current usage metrics is available 48-96 hours after online publication and is updated daily on week days.
Initial download of the metrics may take a while.