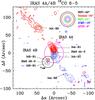
Fig. 3
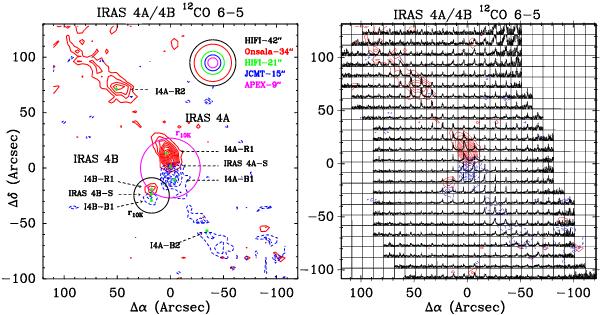
Right: the 12CO 6–5 spectral map of IRAS 4A and 4B over the 240″ × 240″ mapping area. Individual spectra are shown on the TMB scale from –2 K to 12 K and velocity scale from –20 km s-1 to 30 km s-1. The outflows of IRAS 4A and 4B are overplotted over the entire spectral map. The map is centered on IRAS 4A. The contour levels start from 3σ (15 K km s-1) with an increasing step size of 2σ (10 K km s-1). Left: envelopes of IRAS 4A and 4B at the 10 K radius are shown together with the beam-sizes compared. See Fig. 1 caption and Sect. 3.2.1 for the details and the positions at which deep spectra are obtained.
Current usage metrics show cumulative count of Article Views (full-text article views including HTML views, PDF and ePub downloads, according to the available data) and Abstracts Views on Vision4Press platform.
Data correspond to usage on the plateform after 2015. The current usage metrics is available 48-96 hours after online publication and is updated daily on week days.
Initial download of the metrics may take a while.