Free Access
Fig. A.1
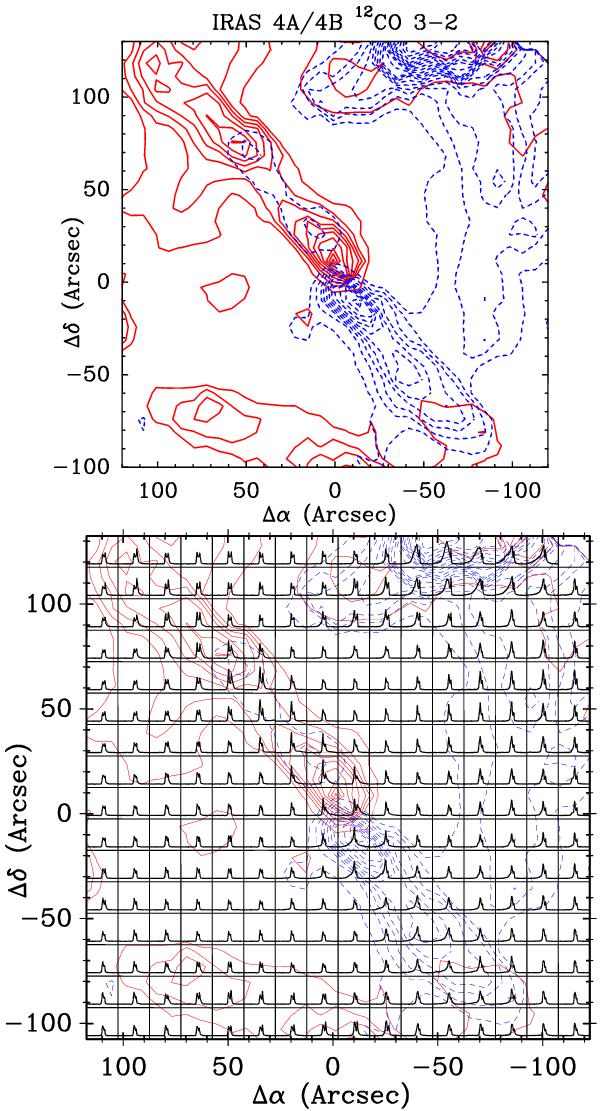
12CO 3–2 spectral map of IRAS 4A and 4B over the 240″ × 240″ mapping area. Individual spectra are shown on the TMB scale from –2 K to 16 K and velocity scale from –20 km s-1 to 30 km s-1. The maps are centered on IRAS 4A. The contour levels start from 20σ (10 K km s-1) with an increasing step size of 5 K km s-1.
This figure is made of several images, please see below:
Current usage metrics show cumulative count of Article Views (full-text article views including HTML views, PDF and ePub downloads, according to the available data) and Abstracts Views on Vision4Press platform.
Data correspond to usage on the plateform after 2015. The current usage metrics is available 48-96 hours after online publication and is updated daily on week days.
Initial download of the metrics may take a while.