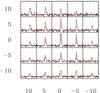
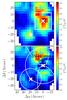
Fig. 19
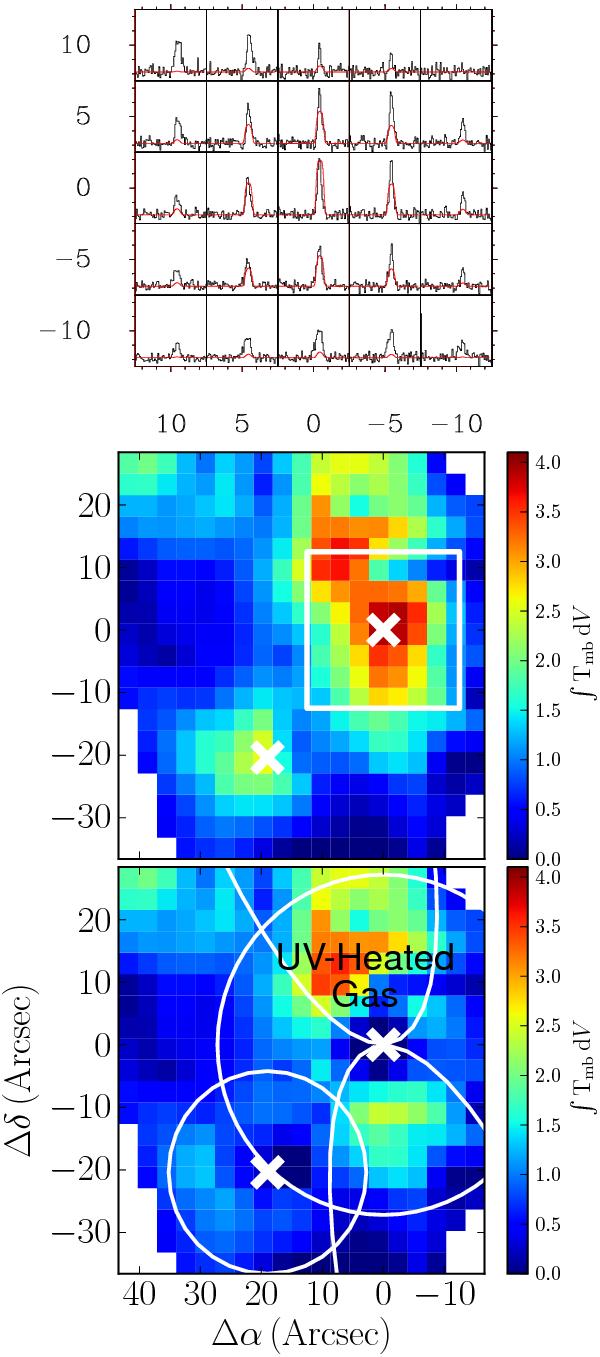
Top: central region of the 13CO 6–5 map covering IRAS 4A. The broad component has been removed from the entire map. The red lines indicate the envelope model emission. Middle: integrated intensity map of the narrow 13CO 6–5 emission, obtained by removing the broad component. The white square box indicates the region covered in the top figure. This map shows both the envelope and UV-heated gas. Bottom: 13CO map obtained after subtracting the model 13CO 6–5 envelope emission convolved to the APEX beam from the above map. White circles show the limits of the 10 K radius envelope and white cones show the direction of the outflows. This map represents the UV-heated gas only.
Current usage metrics show cumulative count of Article Views (full-text article views including HTML views, PDF and ePub downloads, according to the available data) and Abstracts Views on Vision4Press platform.
Data correspond to usage on the plateform after 2015. The current usage metrics is available 48-96 hours after online publication and is updated daily on week days.
Initial download of the metrics may take a while.