Fig. 18
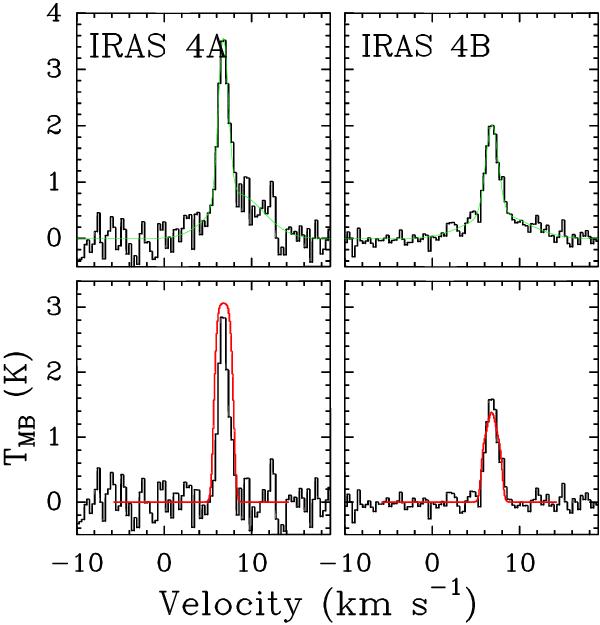
Top panels: 13CO 6–5 spectra of IRAS 4A and 4B at the source positions. The green line is the fit to the narrow plus broad components. Bottom panels: the same lines after subtracting the broad component. The red line indicates the 13CO envelope model emission using the CO drop abundance profile derived from the C18O data. The figure indicates that a substantial fraction of the on-source emission comes from the passively-heated envelope. For IRAS 4A, however, there is also significant extended emission that is not due to the envelope (see Fig. 19).
Current usage metrics show cumulative count of Article Views (full-text article views including HTML views, PDF and ePub downloads, according to the available data) and Abstracts Views on Vision4Press platform.
Data correspond to usage on the plateform after 2015. The current usage metrics is available 48-96 hours after online publication and is updated daily on week days.
Initial download of the metrics may take a while.