Fig. 15
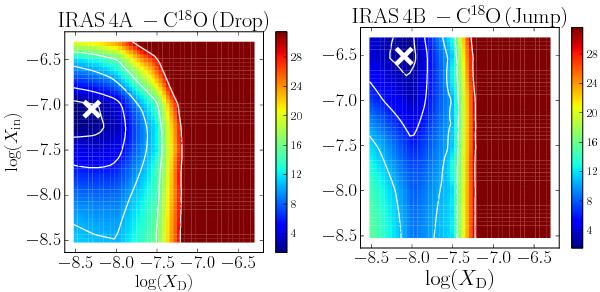
Reduced χ2 plots for the drop and jump abundance profile for the C18O lines in IRAS 4A and 4B, respectively. The freeze-out abundance XD and inner abundance Xin were varied. All lines were taken into account except J = 1–0 and 5–4 owing to the comparatively larger beam sizes. The contours are plotted at 1σ, 2σ, 3σ, and 4σ confidence levels and white crosses show the best-fit values.
Current usage metrics show cumulative count of Article Views (full-text article views including HTML views, PDF and ePub downloads, according to the available data) and Abstracts Views on Vision4Press platform.
Data correspond to usage on the plateform after 2015. The current usage metrics is available 48-96 hours after online publication and is updated daily on week days.
Initial download of the metrics may take a while.