Fig. 14
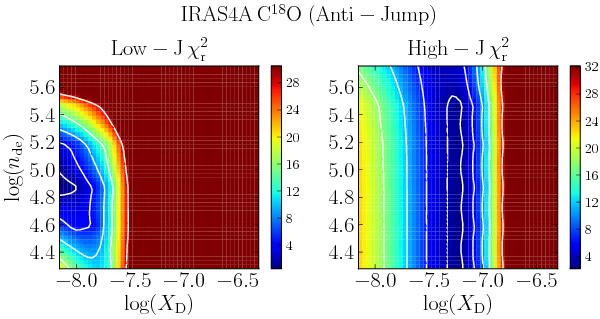
Reduced χ2 plots for the anti-jump abundance profile in IRAS 4A for the C18O lines in which the freeze-out abundance XD and depletion density nde are varied. The left panel take the low-J lines C18O 1–0, 2–1, 3–2 into account, whereas the right panels use the high-J C18O 5–4, 6–5, 9–8, and 10–9 lines. The contours are plotted for the 1σ, 2σ, 3σ, 4σ, and 5σ confidence levels.
Current usage metrics show cumulative count of Article Views (full-text article views including HTML views, PDF and ePub downloads, according to the available data) and Abstracts Views on Vision4Press platform.
Data correspond to usage on the plateform after 2015. The current usage metrics is available 48-96 hours after online publication and is updated daily on week days.
Initial download of the metrics may take a while.