Fig. 12
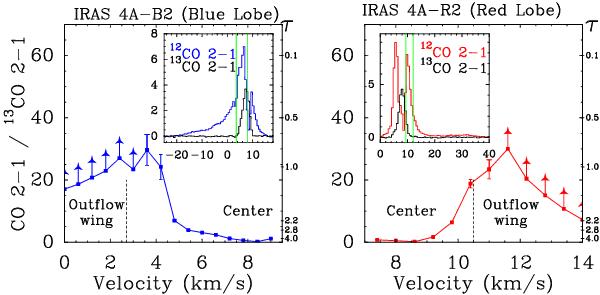
Ratio of TMB12CO 2–1/13CO 2–1 at the I4A-B2 (left) and I4A-R2 (right) outflow positions. The insets display the corresponding spectra and the green lines show the limits of the velocities over which these ratios are taken. The resulting optical depths of 12CO as a function of velocity are shown on the right-hand axes. The spectra are binned to 0.6 km s-1.
Current usage metrics show cumulative count of Article Views (full-text article views including HTML views, PDF and ePub downloads, according to the available data) and Abstracts Views on Vision4Press platform.
Data correspond to usage on the plateform after 2015. The current usage metrics is available 48-96 hours after online publication and is updated daily on week days.
Initial download of the metrics may take a while.