Fig. 1
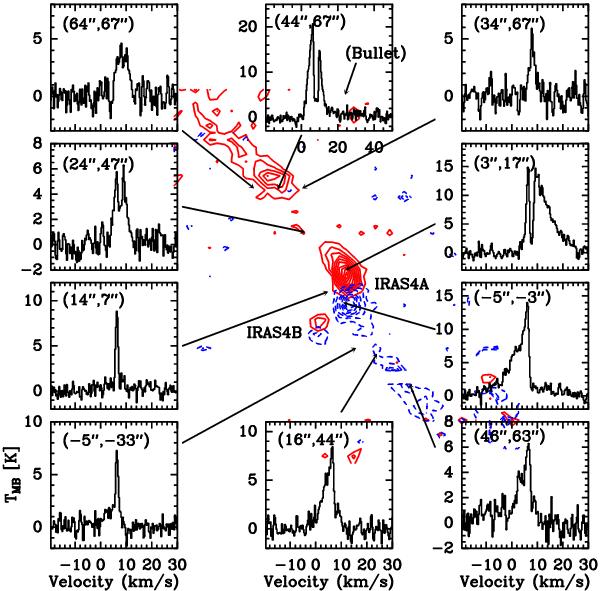
Gallery of 12CO 6–5 spectra from ten different locations. Spectra of the IRAS 4A and 4B central positions are shown in Fig. 2. The arrows indicate the exact locations of the corresponding spectra with respect to the outflow lobes and each spectrum is given with the offset from IRAS 4A. Note the mix of narrow (<2 km s-1) and medium (10–15 km s-1) profiles together with the broad lines (25–30 km s-1) at the outflowing positions close to the center of IRAS 4A. We also note that the velocity scale of the (44″, 67″) panel is different to emphasize the weak “bullet” emission (see text). The vertical scale is for Tmb. The contours are 12CO 6–5 emission where the levels start from 3σ (15 K km s-1) with an increasing step size of 2σ (10 K km s-1). The blue and red velocity ranges are selected from −20 to 2.7 and from 10.5 km s-1 to 30 km s-1, respectively.
Current usage metrics show cumulative count of Article Views (full-text article views including HTML views, PDF and ePub downloads, according to the available data) and Abstracts Views on Vision4Press platform.
Data correspond to usage on the plateform after 2015. The current usage metrics is available 48-96 hours after online publication and is updated daily on week days.
Initial download of the metrics may take a while.