Free Access
Fig. 8
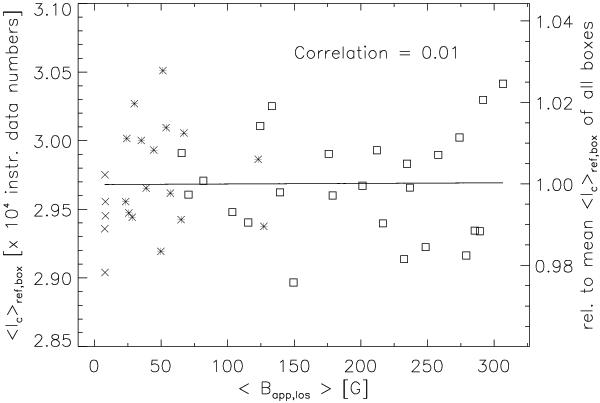
Variation of the mean intensity ⟨Ic⟩ref,FOV of the contrast reference areas in each box (Bapp,los < 100 G), as a function of ⟨Bapp,los⟩ in the box. ⟨Ic⟩ref,FOV is in instrumental data number. The solid line is a linear regression. The right-hand side y axis gives the values relative to the mean value of all boxes.
Current usage metrics show cumulative count of Article Views (full-text article views including HTML views, PDF and ePub downloads, according to the available data) and Abstracts Views on Vision4Press platform.
Data correspond to usage on the plateform after 2015. The current usage metrics is available 48-96 hours after online publication and is updated daily on week days.
Initial download of the metrics may take a while.