Fig. 2
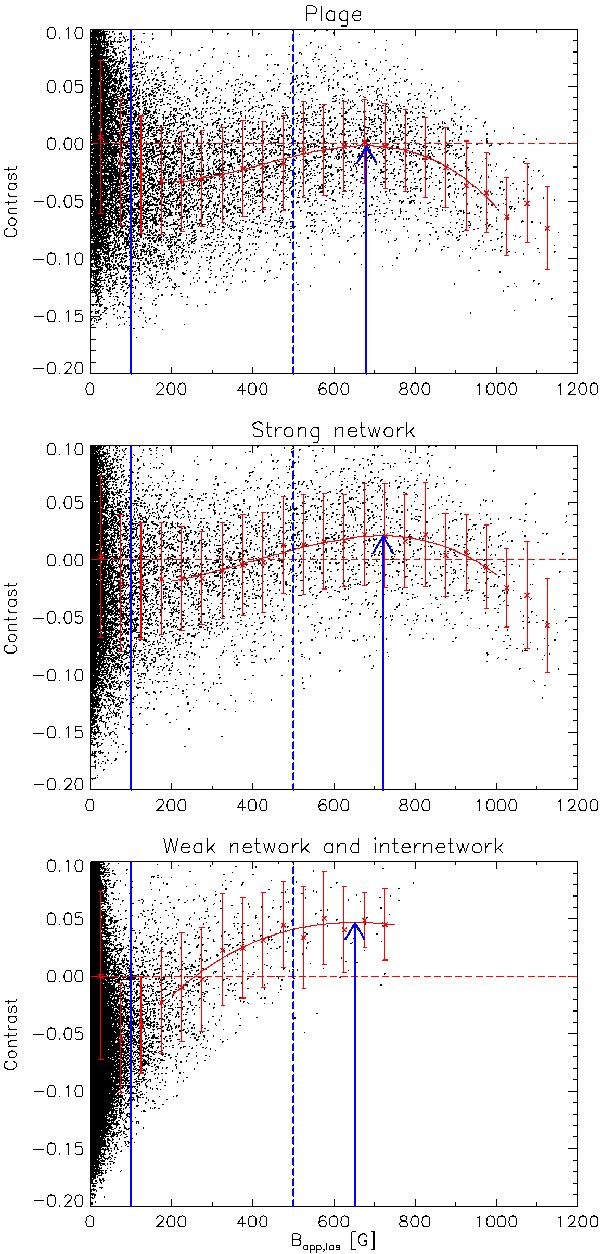
Scatterplots of continuum contrast vs. apparent longitudinal field strength Bapp,los for the boxes shown in Fig. 1, pores excluded. Red crosses: average values of the continuum contrast inside Bapp,los-bins of 50 G width. The red error bars are the standard deviations inside each bin. Solid red curves are third-order polynomial fits of the average values in the range 200 G < Bapp,los < 1000 G. Blue arrows: indicate the peaks of the trend of the contrast vs. Bapp,los. The vertical solid blue lines at Bapp,los = 100 G separate the “weakly magnetized areas” used as contrast and velocity reference and the “magnetic patches”. The dashed blue lines at Bapp,los = 500 G is the upper limit below which pixels can be considered as not belonging to magnetic features.
Current usage metrics show cumulative count of Article Views (full-text article views including HTML views, PDF and ePub downloads, according to the available data) and Abstracts Views on Vision4Press platform.
Data correspond to usage on the plateform after 2015. The current usage metrics is available 48-96 hours after online publication and is updated daily on week days.
Initial download of the metrics may take a while.