Fig. 1
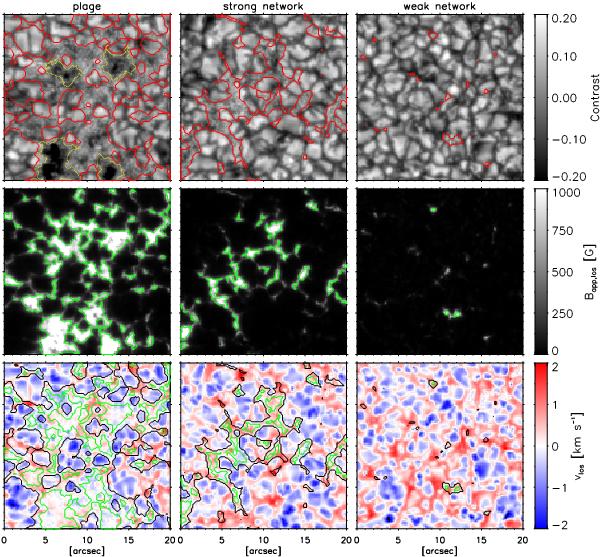
Continuum contrast (top), apparent longitudinal field strength Bapp,los (middle) and LOS velocity vlos (bottom) for three examples of boxes in active region plage (left), strong network (middle) and weak network (right), respectively. All the boxes are located at disk center (μ > 0.99). The weak network box has been cropped to a subfield of 20″ × 20″ for better visibility, although its original size is 70″ × 70″. Yellow contours in top left: pores (see main text) excluded from the scatterplot of contrast vs. Bapp,los (Fig. 2) and from the averaged contrasts (Fig. 7). Red contours (top) and black contours (bottom): delimit the areas where Bapp,los > 100 G (magnetic patches) from the weakly magnetized areas whose mean intensity is used as reference for the contrast (see Eq. (2)). Green contours (middle and bottom): delimit the location of the pixels where Bapp,los > 500 G, so that the region between black and green contours has 100 G < Bapp,los < 500 G.
Current usage metrics show cumulative count of Article Views (full-text article views including HTML views, PDF and ePub downloads, according to the available data) and Abstracts Views on Vision4Press platform.
Data correspond to usage on the plateform after 2015. The current usage metrics is available 48-96 hours after online publication and is updated daily on week days.
Initial download of the metrics may take a while.