Fig. 3
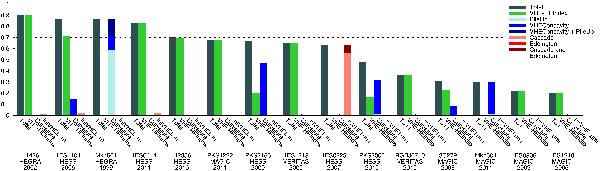
Histogram of the fraction of excluded shapes of the different VHE spectra. The columns show the total fraction of rejected shapes as well as the fraction excluded by the different criteria. The column labeled “Curvature” combines the VHEConcavity and PileUp criteria. Spectra that allow more than 90% of all shapes are not shown.
Current usage metrics show cumulative count of Article Views (full-text article views including HTML views, PDF and ePub downloads, according to the available data) and Abstracts Views on Vision4Press platform.
Data correspond to usage on the plateform after 2015. The current usage metrics is available 48-96 hours after online publication and is updated daily on week days.
Initial download of the metrics may take a while.