Fig. 2
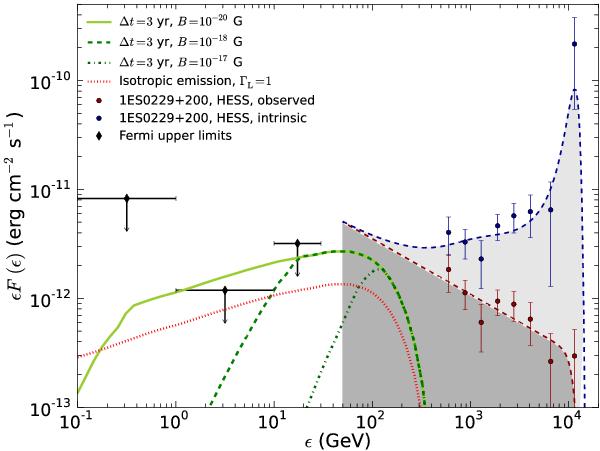
Cascade emission for a certain EBL shape and the VHE spectrum of 1ES 0229+200 (Aharonian et al. 2007a). The observed spectrum (dark red points and line) is fitted with a power law with an exponential cut off and corrected for the EBL absorption (dark blue dashed line and points). The green lines show the cascade emission resulting from the reprocessed flux (light gray shaded area) for a constant emission over the last three years and different magnetic field strengths. The red dotted line shows the reprocessed emission if the e+e− pairs are isotropized. The latter does not overproduce the Fermi upper limits (black diamonds Tavecchio et al. 2010) and hence the corresponding EBL shape is not excluded. The light and dark gray area together are equal to the integrated flux that is compared to the Eddington luminosity (see Sect. 3.2.2).
Current usage metrics show cumulative count of Article Views (full-text article views including HTML views, PDF and ePub downloads, according to the available data) and Abstracts Views on Vision4Press platform.
Data correspond to usage on the plateform after 2015. The current usage metrics is available 48-96 hours after online publication and is updated daily on week days.
Initial download of the metrics may take a while.