Fig. 1
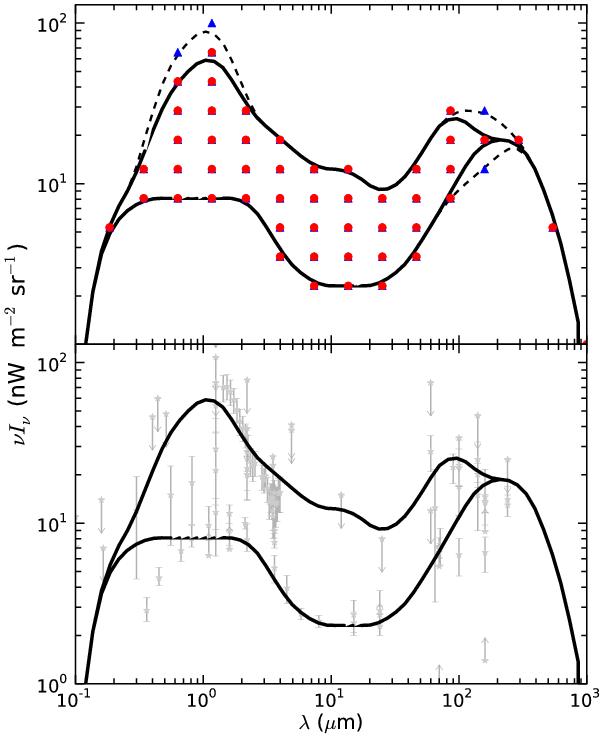
Upper panel: grid in wavelength versus the energy density of the EBL used to construct the EBL shapes for testing (red bullets). Also shown are the minimum and maximum shape tested (solid lines) and the same for the grid of MR07 (blue triangles; dashed lines). Lower panel: minimum and maximum EBL shape tested versus EBL limits and measurements (light gray symbols, see Raue & Mazin 2011, and references therein).
Current usage metrics show cumulative count of Article Views (full-text article views including HTML views, PDF and ePub downloads, according to the available data) and Abstracts Views on Vision4Press platform.
Data correspond to usage on the plateform after 2015. The current usage metrics is available 48-96 hours after online publication and is updated daily on week days.
Initial download of the metrics may take a while.