Fig. 5
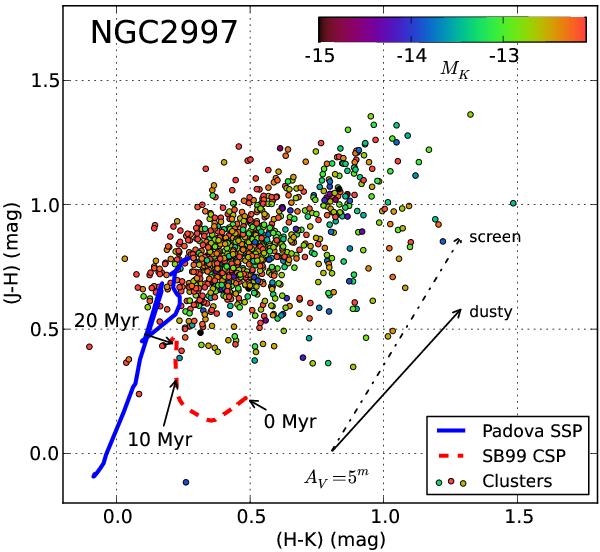
Color–color diagram for non-stellar sources in NGC 2997 with errors <0 05. Evolutionary tracks for a stellar population are shown where the full drawn line is for a Padova SSP model while the dashed line indicates a SB99 CSP model. The color coding of the points indicates their absolute magnitude MK. A standard “screen” reddening vector and one for a “dusty” cluster medium are shown for AV = 5m.
Current usage metrics show cumulative count of Article Views (full-text article views including HTML views, PDF and ePub downloads, according to the available data) and Abstracts Views on Vision4Press platform.
Data correspond to usage on the plateform after 2015. The current usage metrics is available 48-96 hours after online publication and is updated daily on week days.
Initial download of the metrics may take a while.