Fig. 12
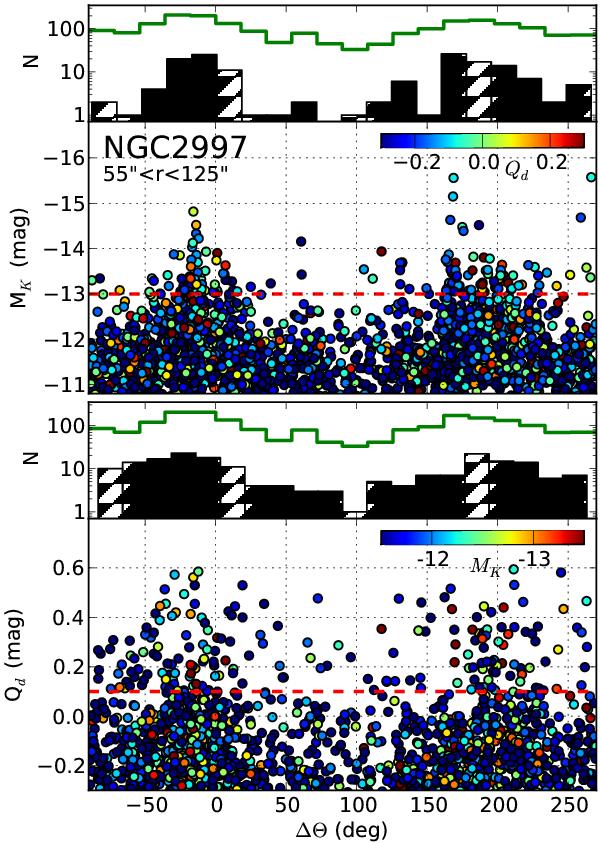
Absolute magnitude MK and Qd index of non-stellar sources as a function of their azimuthal distance from the two-armed spiral pattern, where ΔΘ = 0° and 180° denote the relative Ks-band intensity maxima given by the phase of m = 2 FFT component. The top diagram shows MK with colors indicating the Qd index. The number of clusters with MK > –13m is displayed as a full drawn curve, while the hatched histogram shows the brighter clusters. The low section shows Qd with MK used for color coding. The full drawn histogram indicates older clusters with Qd < 0 1, whereas younger ones are shown by hatched bars.
Current usage metrics show cumulative count of Article Views (full-text article views including HTML views, PDF and ePub downloads, according to the available data) and Abstracts Views on Vision4Press platform.
Data correspond to usage on the plateform after 2015. The current usage metrics is available 48-96 hours after online publication and is updated daily on week days.
Initial download of the metrics may take a while.