Fig. 3
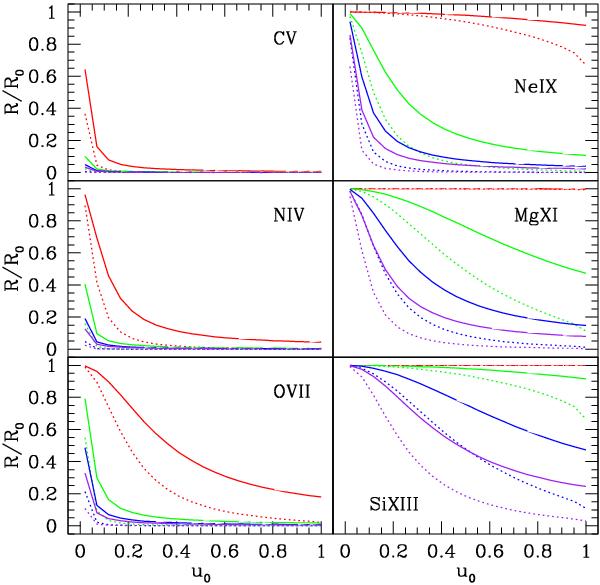
Effects of the spatial distribution of X-ray emitting gas on the behavior of R for six helium-like ions: C v (top left), N vi (middle left), O vii (bottom left), Ne ix (top right), Mg xi (middle right) and Si xiii (bottom right) for each of our hypothetical stars with average effective temperature of 10 000, 20 000, 30 000 and 40 000 K (red, green, blue, and purple respectively). R / R0 is plotted versus inner radius of gas in inverse radius u0. The substitution of variables, u = r⋆ / r, simplifies the calculation. The solid line indicates how much R is depressed from its nominal value if the gas is distributed from r = ∞ (u = 0) to r = r0 (u = u0). The dotted line shows the results if hot gas exists only at u0. The value or the dotted line at u0 = 1 / 2 is equivalent to our fiducial value elsewhere of rgas = 2r⋆ at zero displacement phase.
Current usage metrics show cumulative count of Article Views (full-text article views including HTML views, PDF and ePub downloads, according to the available data) and Abstracts Views on Vision4Press platform.
Data correspond to usage on the plateform after 2015. The current usage metrics is available 48-96 hours after online publication and is updated daily on week days.
Initial download of the metrics may take a while.